

Sales and marketing are the twin engines driving business growth. Yet, with all the data available today, it’s easy for teams to feel overwhelmed by endless metrics and unclear connections between marketing efforts and revenue. This is where a funnel dashboard becomes a game-changer. By turning raw numbers into actionable steps, a well-designed funnel dashboard can help businesses focus their resources on strategies that truly move the needle.
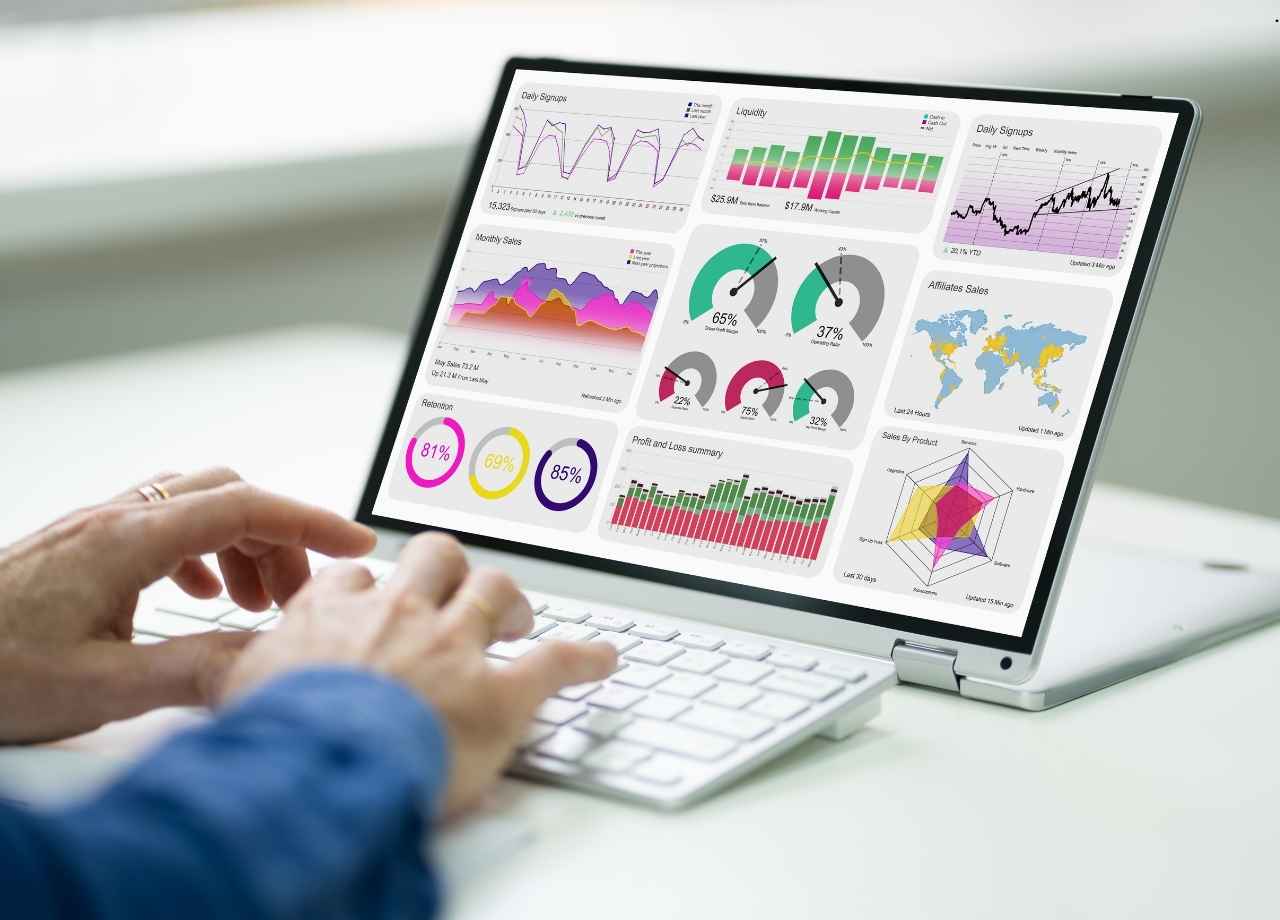
At its core, a funnel dashboard visually represents how potential customers move through the stages of your sales and marketing pipeline. From the first touchpoint to final conversion, this tool shines a light on areas where customers are lost, campaigns underperform, or opportunities can be maximized.
If your team struggles to connect marketing initiatives with meaningful sales results, a funnel dashboard might just be the tool you didn’t realize you were missing.
How a Funnel Dashboard Bridges Gaps Between Sales and Marketing
One of the biggest challenges in aligning sales and marketing lies in communication. Marketing teams track clicks, impressions, and leads, while sales teams focus on meetings booked, deals closed, and revenue earned. Without a clear bridge between these data sets, departments often operate in silos.
A funnel dashboard integrates these metrics into one cohesive view. Imagine being able to see, at a glance, how many leads a campaign generated, how many were qualified, how many converted into sales opportunities, and, ultimately, how much revenue was earned. This alignment helps both teams measure their contributions to overall goals, fostering collaboration and efficiency.
Key Metrics to Track in a Funnel Dashboard
A funnel dashboard isn’t a one-size-fits-all tool. The metrics you track will depend on your specific business model, target audience, and objectives. However, certain indicators are universally valuable:
Lead Source Performance
Understanding where your leads are coming from—organic search, paid ads, referrals, or social media—can help you allocate your budget effectively. Are your high-value customers coming from one specific channel? Or is one underperforming despite significant spend?
Conversion Rates Between Stages
Are leads dropping off after visiting your website? Or are they engaging with initial content but failing to book a demo or request a quote? Tracking conversion rates between stages pinpoints bottlenecks in the funnel.
Average Time to Conversion
How long does it take, on average, for a lead to move through your funnel? If the process is too slow, you risk losing potential customers to competitors.
Customer Lifetime Value (CLV)
While most funnel dashboards focus on acquisition, understanding the long-term value of customers can be equally important. Are your marketing efforts bringing in customers who stay loyal, or do they churn quickly?
Pipeline Value
This metric calculates the potential revenue from all deals currently in the funnel. It’s a critical figure for forecasting and resource planning.
Optimizing Strategies With Funnel Insights
Once you’ve set up your funnel dashboard, the real work begins: acting on the insights it provides. Let’s explore how businesses can use this data to optimize both marketing and sales strategies.
Identify and Address Bottlenecks
If your dashboard shows a significant drop-off between two stages—say, between initial interest and a product demo—it’s a signal that something in that stage isn’t working. Perhaps your demo scheduling process is cumbersome, or your follow-up emails lack urgency.
For instance, Rediem offers brands tools to simplify customer interactions and foster engagement, ensuring potential leads don’t slip through the cracks during critical stages. By automating repetitive tasks and creating personalized experiences, businesses can close these gaps efficiently.
Refine Targeting and Messaging
Metrics like lead source performance and customer lifetime value can guide more precise targeting. If your highest-value customers consistently come from LinkedIn ads, it makes sense to double down on that channel while revisiting your efforts on others.
Similarly, tracking audience behaviors can inform messaging. Are your best leads responding to detailed whitepapers or quick how-to videos? Knowing this allows you to tailor content formats and tones to your audience's preferences.
Improve Forecasting and Resource Allocation
With a clear understanding of your pipeline value and conversion rates, you can more accurately forecast revenue. This helps leaders make informed decisions about hiring, budgeting, and scaling efforts.
For example, if your funnel dashboard shows that your team is closing 20% of qualified leads, and you’re on track to generate 1,000 new leads next quarter, you can predict future revenue with relative accuracy. This foresight prevents over- or under-commitment of resources.
Best Practices for Building an Effective Funnel Dashboard
To fully unlock the potential of a funnel dashboard, you’ll need to design it with care. Here are some tips:
Define Clear Stages
The stages of your funnel should reflect your customer journey. A B2B SaaS company might have stages like Awareness, Lead Qualification, Product Demo, Proposal, and Closed Deal, while an e-commerce business might focus on Website Visit, Add to Cart, Checkout, and Purchase.
Limit Data Overload
While it’s tempting to track everything, too much data can overwhelm your team and dilute focus. Stick to metrics that directly impact decision-making and business goals.
Update Data Regularly
A dashboard is only as good as its data. Ensure integrations with your CRM, marketing automation software, and analytics tools are seamless, and set up automated updates where possible.
Make It User-Friendly
Your dashboard should be intuitive, even for non-technical team members. Use clear labels, avoid jargon, and provide training if needed.
Integrate With Existing Tools
Many businesses already use platforms like HubSpot, Salesforce, or Google Analytics. A great funnel dashboard should integrate with these tools to minimize disruptions to your workflow.
The Future of Funnel Dashboards
As technology advances, the capabilities of funnel dashboards are expanding. AI and machine learning, for instance, can identify patterns and make predictive recommendations. Tools are becoming more personalized, allowing teams to customize dashboards for specific campaigns, product lines, or audience segments.
For businesses focused on community engagement, platforms like Rediem are stepping in to merge traditional sales funnels with more interactive, relationship-driven models. This shift acknowledges that modern customers expect more than a transaction—they want connection, sustainability, and value-driven engagement.
By integrating tools that prioritize these elements, funnel dashboards are evolving from simple reporting tools into strategic growth enablers.
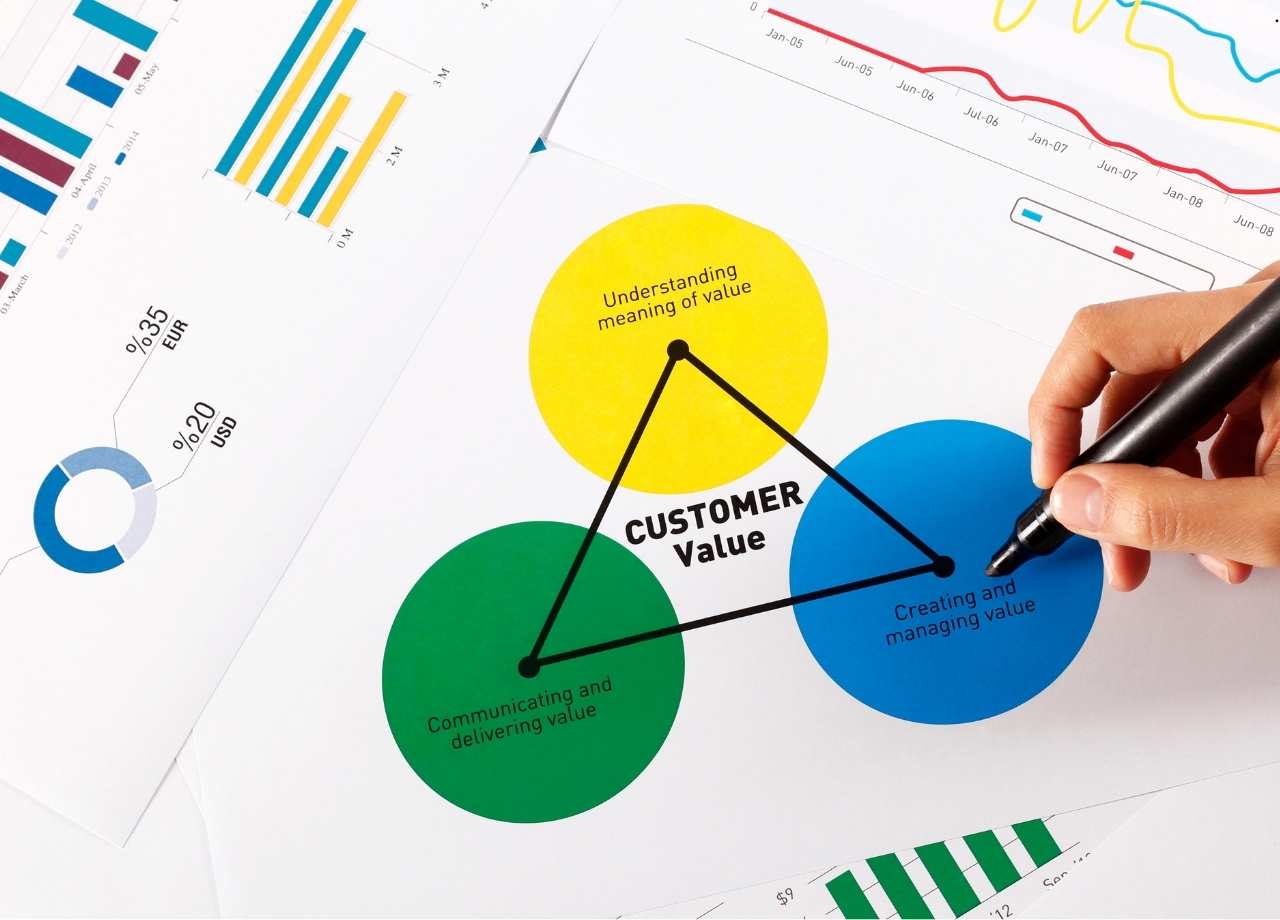
A funnel dashboard isn’t just a tool—it’s a roadmap. It highlights where your business is thriving and where it needs improvement. For sales and marketing teams, it bridges the gap between effort and outcome, ensuring every campaign, every lead, and every deal counts.
Investing time and resources into building and optimizing a funnel dashboard isn’t just about tracking metrics; it’s about understanding your customers and delivering what they need at every stage of their journey. When done right, it doesn’t just enhance your strategy—it transforms your results.
